
This article has been modified for Firstlinks. You can download the full original article “Red pill or blue pill? Navigating the matrix of fixed income” here.
In the film The Matrix, the hero of the story, Neo, has been unwittingly living in a dreamworld his entire life. He is eventually given the opportunity to free himself by taking either a red pill, which will allow him to learn the truth, or a blue pill, which will allow him to stay in his current, computer-simulated reality. As we all know, Neo chooses the red pill and must face the harsh reality of the world.
Past strategies unlikely to work in future
This is a fitting analogy to the world of fixed income investing. Fixed income investors have been living in a certain world for a long time, but that reality has now changed and investors are facing a tough decision: continue as usual or accept the new normal and learn to navigate a changed landscape.
Investors in fixed income products generally fall into two categories. The first group are those that invest in the products because they want some level of income, modest capital return and capital protection. There are a range of products to choose from to target specific objectives and risk tolerance.
The second group are those that buy fixed income products because they believe these assets will perform well when there are corrections in their risk assets (mainly listed equities), helping to reduce their overall portfolio volatility. This second approach has worked reasonably well for the last 20 years or so, but we believe it is highly unlikely to work as well over the next decade or longer.
Understanding volatility and duration
The chart below looks at the volatility of the Japanese Government Bond (JGB) market. Volatility has been steadily declining as the absolute level of yields has remained low and the local central bank has continued to increase its ownership of the market. We believe the US and many developed markets will increasingly look like this over time.
Rolling 30 day volatility of 5yr duration JGBs

Source: Bloomberg
The following chart shows eight significant corrections in the Japanese equity market over the past 25 years. We have roughly divided them into periods of higher interest rate volatility (pre-2010) and lower interest rate volatility (post-2010).
The chart shows in a low volatility world the effectiveness of interest duration to hedge out equity volatility is substantially reduced. In the higher interest rate volatility environment, bonds on average rallied 3.7% when equities sold off 37%, but in the lower rate and volatility periods yields rallied on average only 0.5% while equities sold off 24%.
Japan: Bond performance in equity sell offs
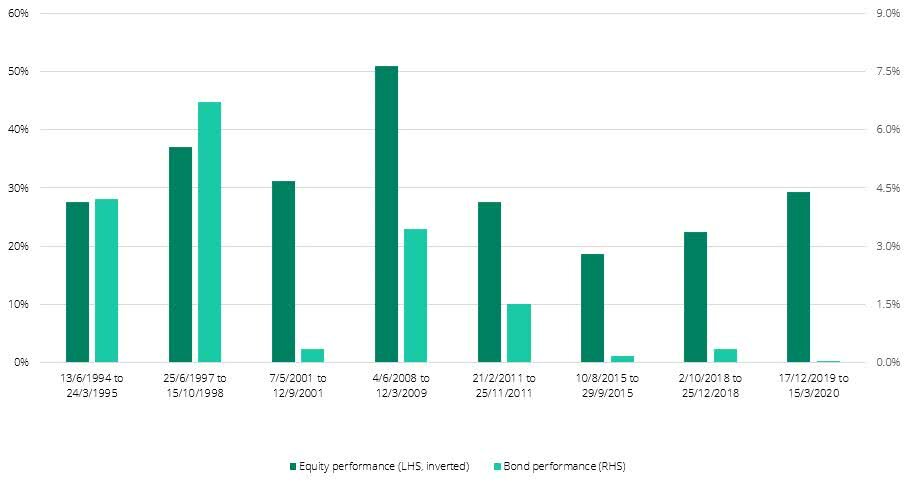
Source: Bloomberg
The problem with most places outside Japan is the future is not going to look like the past. We have moved into an environment of exceptionally low government bond yields and in many cases negative interest rates. Unfortunately, the new reality is likely to be with us for a long time to come.
We believe government bond yields have reached, or are close to reaching, a lower bound and it is will be difficult for individual long duration government bonds or funds to generate returns like they have in the past.
The chart below is a good depiction of the challenges faced by people investing in these products:
Ausbond Composite Index
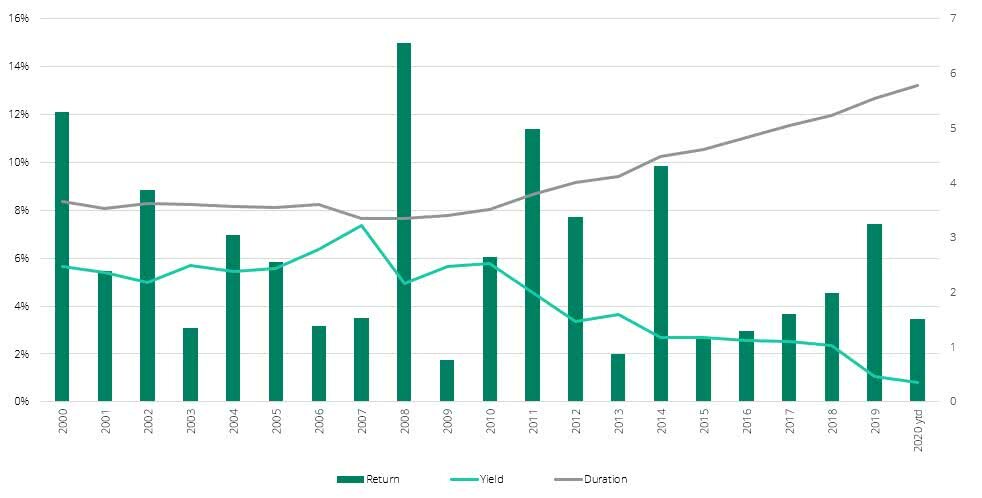
Source: Bloomberg
This chart looks at the return, yield, and duration of the Ausbond Composite Index, which is the reference index/benchmark for most long duration fixed income products in Australia. There are three observations to make.
First, the average yield on the index has dropped from around 6% in 2010 to around 0.8% today.
Second, the average duration (or interest rate risk) in the index has increased from 3.5 years to around 6.0 years today, a 71% jump.
Third, the drop in yields led to many years of reasonable performance with the index averaging 5.3% p.a. over the last 10 years. However, the only way that can continue is if bond yields drop another 5-6%, in other words, if they drop to below negative 5%.
For investors in funds that mirror long duration indices (regardless of whether the strategy is active or passive) with the intention of hedging out equity risk, the conclusions are pretty obvious: future expected returns will be much lower and there is a lot less protection against an equity correction at a much greater cost. This makes long duration bonds, such as government bonds, a much less attractive proposition.
ICE Bank of America MOVE Index
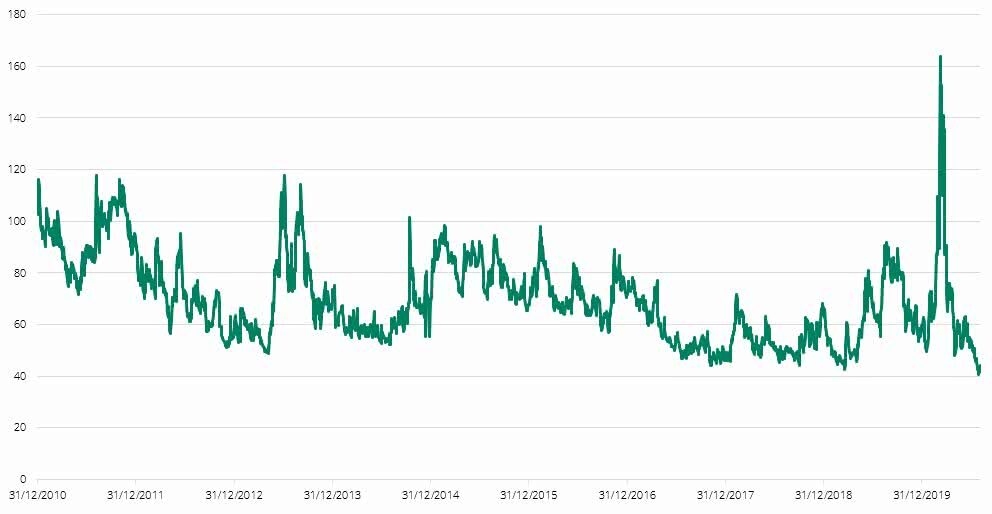
Source: Bloomberg
The above chart looks at the volatility of interest rate markets. Volatility is at historic lows and given the unprecedented volume of purchases being undertaken by the world’s central banks, we expect this to continue. To make money from trading requires volatility.
The simple 60/40 is facing extinction
The harsh reality of our new investment world is everyone will have to re-examine the tools and strategies they are using to try to hedge out the riskier assets in their portfolios. The idea of running a simple 60/40 portfolio and ‘set and forget’ is facing extinction.
So, the logical question is what can we do to hedge out equity risk?
Investors still want the higher returns equities tend to provide over time but would also like to reduce the risk associated with the allocation. There are several options investors can consider in this environment.
One compelling approach is to significantly reduce allocations to long duration government bond fund strategies and reallocate a portion of those funds into a low duration, investment grade credit fund.
A portion of the additional income earned by that switch could then be spent on a much more targeted hedging strategy to help protect equity exposure. A basic actively managed, short duration Australian credit fund can readily earn 1-1.5% more than the Ausbond Composite Index, without relying on yields moving lower to generate additional returns. This approach allows investors to use their fixed income allocation in a much more effective way than sitting in simple long duration government bonds.
Other approaches are much less straightforward and more costly. These may include:
- a more dynamic asset allocation and trying to time the market
- investing in ‘safe haven’ assets, such as gold, and Swiss Francs which tend to perform during an equity sell-off
- employing an option strategy, or
- holding a short equity position in your portfolio.
Fortunately, none of us live in The Matrix (at least I don’t think we do) so our choices are not as dire as Neo’s but we clearly need to change the way we look at the reality of the new investment landscape.
Some data suggests that about 40-50% of the money invested in fixed income products in Australia is invested in traditional longer duration funds (both active and passive). These investors might want to re-evaluate if these types of products still make sense for them in this new low-rate, low-volatility world. Hopefully, the red pill is not too bitter to swallow.
Read the original article on Firstlinks
Disclaimer: Please note that these are the views of the writer and not necessarily the views of Daintree Capital. This article does not take into account your investment objectives, particular needs or financial situation.