
Most investors spend much more time assessing, calculating, comparing and pursuing returns than they do considering the other side of this same coin: the risks taken to achieve that return. However, in the current market conditions, investors – and particularly conservative investors – should consider the inevitable tradeoffs they are making when seeking to maintain certain levels of income.
This article explores two simple questions:
- How should you invest to earn a 5% per annum return with the least risk?
- Has the optimal mix changed over time?
To spoil the fun a little, the answer to Question 2 is yes. Optimal portfolio allocations have shifted considerably, but in essence, have done so due to the gradual but consistent fall in market interest rates.
This is important because, in addition to indicating the return available from cash and bonds, interest rates are also used to value cashflow producing assets such as shares, property and infrastructure. As the interest rate falls, the value of future cashflow rises.
Chart 1: Australian 5-year government bond yield
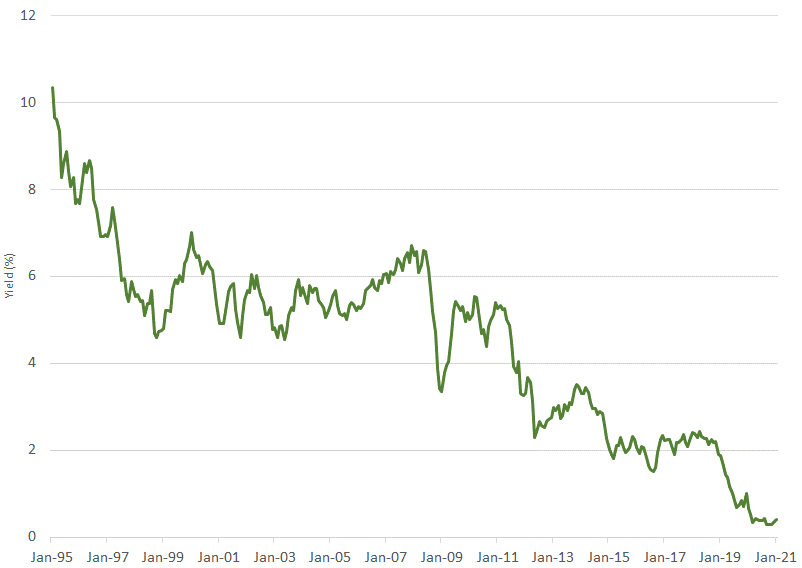
Source: Bloomberg
While interest rates are a key driver, there are other important factors. The outcomes of an investment in a term deposit or government bond are predictable, but the future cashflows of a company or the prospects for an investment property can shift quickly.
The most common measure to represent this risk is volatility, but many investors find this statistical measure difficult to bring to life. Instead, for this article, we will represent risk in terms of the likelihood of a negative return over a 10-year period.
Table 1: Asset Class Risk Assumptions
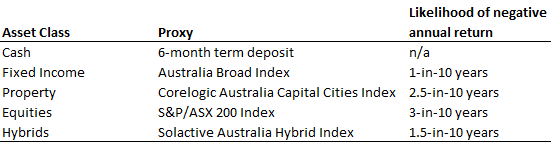
Source: RBA, ICE, Corelogic, Bloomberg
How have portfolios changed over time to achieve 5%?
Chart 2 provides some important information on the ‘5%’ portfolio.
First, there is a strong correlation between market interest rates and the composition of the portfolio. Second, our investor seeking 5% per annum is forced to take more risk to achieve the stated aim as the market interest rate has fallen over time.
Chart 2: Optimal portfolios to achieve at least 5% per annum (risk-adjusted)
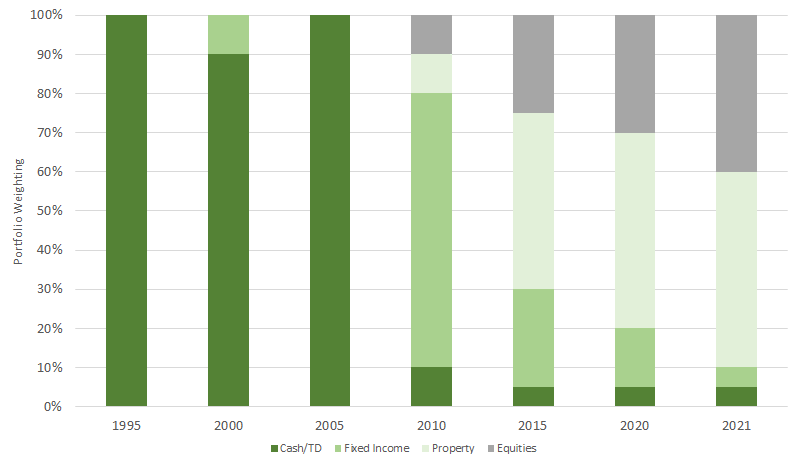
Source: Bloomberg, Corelogic, Daintree
In contrast to the turmoil of the 1987 stock market crash and the ensuing recession, financial markets of the mid-to-late 1990s were characterised by a general sense of calm. The RBA cash rate started the decade at 14-15%, but by January 1995 had fallen to 7.5%, with a 6-month deposit rate of 9.15% pa. This easily exceeds our requirements and the risk involved in earning that return would be very low.
By January 2000, interest rates had continued to ease, with the same 6-month deposit rate falling to 5.99%, still sufficient to meet our criteria. However, the yields on offer from fixed income were higher than those for deposits, and after accounting for the risk involved in a broad-based fixed income exposure, the optimal portfolio includes a small weighting to fixed income.
While cash rates were relatively stable through January 2005, the future returns available from credit fell considerably as longer-term interest rates fell. This drove solid returns from our small exposure to fixed income, but our investor was now faced with reinvestment risk. Therefore, in 2005 we could revert to bank deposits to achieve our goal, at the expense of potential further upside in asset values.
The following five years were eventful, to say the least, as the GFC created significant turmoil across the board. By now, our investor was being forced to deviate significantly from cash to attain their return target, with a significantly higher allocation to fixed income, property and equities, despite the lingering volatility.
By 2015 and continuing through 2020, apart from a nominal exposure to cash and fixed income, our investor had come to rely on growth assets such as shares and property to provide their return. Using our assumptions in Table 1 for the gross income return from a property or share portfolio, there is still some reliance on capital growth needed to achieve our goal.
Are there other options?
The analysis so far should make for uncomfortable reading for conservative investors. The prospect of cash or deposit rates rising to anywhere near 5% in a reasonable timeframe is remote.
In January 2021, the yield on a 6-month deposit ranges between only 0.3-0.6% pa. A broad fixed income index is offering 0.8-0.9% pa. The ASX 200 gross dividend yield is 3.6% pa, and the average gross yield from residential investment property is currently about 4% pa.
So apart from relying on capital growth or using leverage, no combination of these broad asset classes will achieve a 5% income return. Furthermore, interest rates cannot go much lower, removing one of the more reliable tailwinds for asset prices.
One asset class has not been included so far may improve overall outcomes by offering a predominantly income return at a manageable level of risk. Despite being a relatively ‘young’ asset class, hybrid securities are designed to have fixed income and equity characteristics. Specifically, income is paid periodically and there are defined call dates like many fixed income securities, while in certain circumstances hybrids can be converted to equity of the underlying issuer.
Importantly, observed volatility over time has tended to be a fraction of that of equities. On average, hybrid securities will register a negative return over a calendar year once every seven years. This equates to about one-third of the volatility experienced in equity markets.
In Australia, we have only seen three calendar years where hybrid returns were negative since the turn of the century, but on two of those occasions the maximum drawdown was less than 3%. Average returns, inclusive of franking, over this same period were approximately 6.5% pa.
With the inclusion of this additional data, optimal portfolio allocations would change to include hybrids in most time periods.
Chart 3: Optimal allocations including hybrids (risk-adjusted)
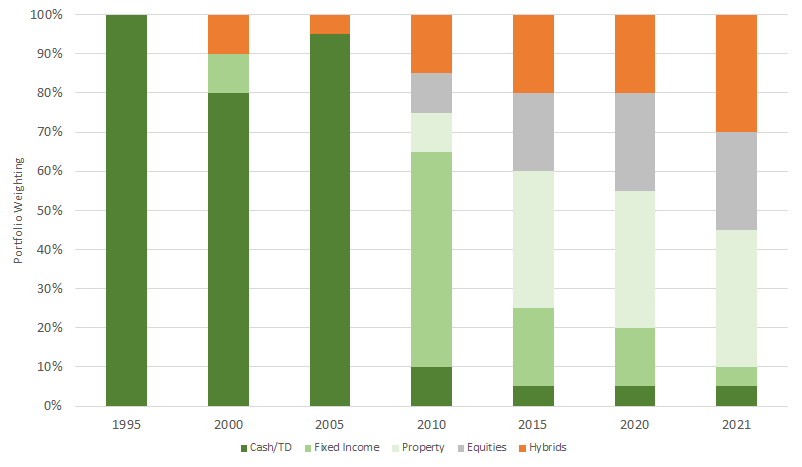
Source: Bloomberg, Corelogic, Daintree
Hybrid securities have been a part of Daintree Capital’s process for some time. We have identified the attractive return and risk characteristics of this asset class and have included them in our High-Income Trust since its inception in November 2018.
Implications for investors
The monumental changes in interest rates have forced all investors to revisit many fundamental assumptions about risk and return. The seemingly unstoppable trend of falling interest rates has changed the game when it comes asset allocation and the role of different types of assets within portfolios. While we do not expect a reversal of these trends anytime soon, the zero lower bound presents a formidable barrier.
Conservative investors are now forced to choose between:
- protecting capital in exchange for lower income;
- drawing down capital over time to maintain a certain living standard; or
- taking additional risk in search of higher yields.
Our analysis shows that when it comes to the third option, the amount of additional risk that must be taken is rising over time. Therefore, we believe it is becoming increasingly important to prioritise risk management as part of the portfolio construction process.
Disclaimer: Please note that these are the views of the writer and not necessarily the views of Daintree Capital. This article does not take into account your investment objectives, particular needs or financial situation.