
As a person who spent his formative years in the 80’s and whose life was heavily influenced by movies like Top Gun (I’m still struggling to get over the death of Goose), I’m obviously thrilled to see the release of the new movie. What hasn’t been quite so thrilling is the performance of risk assets over the last little while. We’ve seen the S&P 500 correct 23% over the last six months and Australian credit spreads have more than doubled over the last sixteen months. We are all aware that this has largely been driven by central banks around the world tightening financial conditions to attempt to reign in inflation that is running at multi-decade highs. Central banks have been providing unprecedented levels of support to financial markets going all the way back to the Global Financial Crisis (GFC) of ‘08-’09 and now that process is reversing. There are lots of apt analogies to choose from here such as removing the punchbowl, hitting the brakes or taking the wind out of the market’s sails, but I’ll go with a reference to one of the best series of all time and say they are accelerating a change in financial seasons and a winter is coming (if not already here).
If you are like most investors, you have probably been scratching your head over the last six-to- nine months and wondering if there is any place to hide and asking yourself questions like “Is it over yet?” or “How much more can this market correct?”. The truth is there have not been too many places to hide over the last year:
- Cash and term deposits would have protected your capital better than most financial assets, but it can be challenging and possibly impractical to sell everything you own and go to cash.
- Government bonds have traditionally been the safe-haven in times of stress, but that clearly hasn’t been the case in this correction. The Ausbond Government Bond index is down 8.5% over the last twelve months.
- Gold hasn’t been a terrible choice but its roughly where it was twelve months ago with a bumpy ride along the way.
- Listed equities are down anywhere from 10-30% depending on the market.
- There are assets that are not marked to market that have been very stable over the last twelve months, but that obviously understates the actual risk taken in these strategies.
In short, there have not been many safe havens in the traditional asset classes over the last twelve months. But where does that leave us today? Is the worst behind us or is there more to come? Exactly how much worse can things get?
What are Credit Spreads?
As an unconstrained Investment Grade bond fund manager, most of the risk in our portfolios is driven by the change in the general level of credit spreads. As a refresher for people who don’t live and breathe the fixed income markets, credit assets trade at a margin above the risk-free rate. This margin compensates investors for the increased risk associated with lending to an institution with greater default risk than the government. The difference between government risk pricing and corporate risk pricing is referred to as the credit spread. Generally speaking, the riskier the borrower the wider the spread demanded over the risk-free rate. For example, in the current market five-year A-rated assets are trading around 1.50% above the government bond curve while BBB-rated assets are trading about 2.10% higher.
From an investment perspective, when markets get nervous or more pessimistic about the outlook the credit spread or risk premium demanded tends to increase. This is similar to equity markets selling off to compensate for lower expected earnings or a reduction in the multiple investors are willing to pay for a dollar of earnings. These wider credit spreads in bond markets push down prices and can result in short term losses. However, there is a critical difference between a correction in the bond market and those in the equity markets. Bonds are a contractual obligation to pay money back at a certain time at an agreed price. Equities have no such contractual obligation, so when equity markets go down there is no guarantee you will recover those losses. However, any near-term loss in performance of fixed income assets is contractually guaranteed to be recovered as long as the issuer doesn’t default.
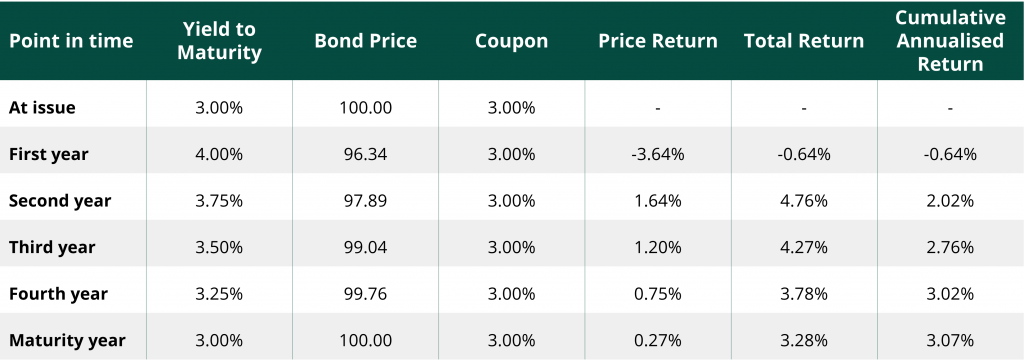
Source: Daintree. Modelled price and returns of a 5-year semi-annual coupon bond through its life. Coupons are re-invested at the average of the yield at the start of the period and the yield at the end of the period.
The table above provides an example of this. As you can see, a near term sell off results in short term losses but then a higher forward expected return over the life of the bond. This example applies to bond funds as well. For example, the Daintree Core Income fund has had multiple negative monthly returns given this credit spread widening. However, if we were to reset the portfolio to normal risk-on positioning today the forward expected return on the fund would be close to 5%.
In this example, a five-year bond is bought at issue for 100 with a 3% annual coupon. At the end of the first year, rates have risen to 4% and the price has fallen to 96.34. The price loss is 3.64% less the 3% coupon to give an annualised return of -0.64%. But importantly from that point forward, the expected return of the bond is much higher resulting in an attractive entry level. Over the life of the bond, rates and prices change but the bond delivers the expected return (compounded to reflect the semi-annual coupon).
Where are credit spreads likely to peak?
Let’s start with a couple of comments about forecasting. Daintree does not give much weight to forecasts. There have been lots of academic studies which show that human beings are often terrible at forecasting. We suffer from all sorts of biases, struggling with things where we have limited experience, but at the same time can be grossly overconfident of our conclusions when we have just a little bit of knowledge or experience. The old cliché “Often wrong but never in doubt” seems as accurate today as it ever was. At Daintree, we work to remain very humble about our ability to forecast the future. The future is unknowable, but at the same time we have to make investment decisions today with imperfect and incomplete information. Therefore, we need to have a view, but also allow for a wide margin of error with respect to that view, because we will inevitably be wrong and surprised by what happens in the future.
As a starting point, we can consider the chart below which looks at the average Australian investment grade credit spread going back to 2004. The observations we would make are:
- While spreads have widened a fair bit over the past 16 months, they are only modestly wider than the average level over this period.
- Spreads are still well below the levels reached during the GFC Crisis in ’08-’09 and the European sovereign debt crisis in ’11-’12.
- Spreads are just now reaching the levels seen during ’15-’16 commodity weakness as well as the COVID crisis in March 2020.
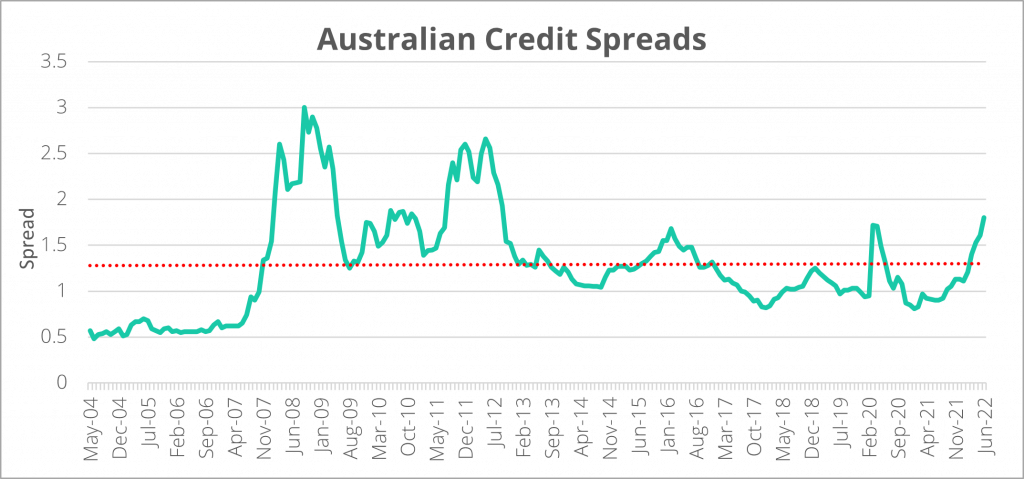
Source: Bloomberg
So, this begs the question, how much further could they widen? We have mentioned our reluctance to make forecasts, but it seems reasonable to conclude that short of a large tail event (such as Russia expanding its aggression into Europe more broadly) that spreads are not likely to reach the wide levels seen in the GFC or the European sovereign debt crisis.
Our justification for this view is based in-part on increased financial system resilience and improvements in corporate balance sheets:
- Despite the fact that accommodation is now being reduced, global central banks remain much more supportive of financial stability than during the GFC. Structurally, liquidity in credit markets is significantly better than it was then and banks are much better capitalized.
- Australian corporations in general have done a good job improving their financial position over the last few years. The chart below shows a material improvement in the average amount of net debt of companies in the ASX 200 index relative to cashflow (approximated by EBITDA).
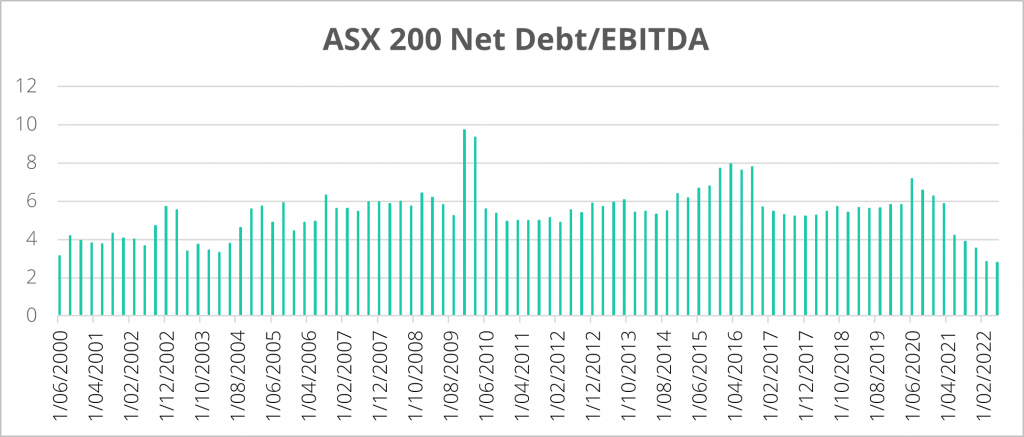
Source: Bloomberg
On the flip side, markets have not had to contend with the extraordinary levels of inflation we are now seeing for many decades. Central banks have been extremely accommodative for well over a decade. Clearly there is going to be pain involved as central banks begin to remove that accommodation and work to reduce inflation. Given that, we have been expecting a meaningful repricing of credit spreads. As a rough guide, we have been looking for a correction in Australian credit spreads toward a range of 1.75% to 2.25%. The market is currently around the low end of our estimated range, and therefore on balance we believe there could be more spread widening to come, but we do feel the vast majority of the repricing has already occurred.
What about interest rates?
One other thing to consider in the current market environment is interest rate positioning. Most people in the market we speak to have been telling us they have been underweight interest rate duration for a long period of time and given the back up in government bond yields, they are now wondering if this a good opportunity to start adding duration back into their portfolios. We believe this is a fair question but note there are a couple of things to consider.
First, in a high inflation environment, historically the correlation between government bonds and equities has tended to be positive, meaning they sell off at the same time. Adding government duration to hedge out modest equity corrections may lead to disappointing results in this environment.
Second, adding long duration government bonds purely as a hedge against significant tail events (such a world war) does make sense in our view. Our suggestion would be to find the cheapest possible long duration government bond index fund for that portion of your portfolio.
However, thirdly, if fixed income is viewed purely as a defensive allocation which earns a modest income and minimizes your capital volatility, allocating to funds that mirror simple indices such as the Ausbond Composite index is sub-optimal. To illustrate why, consider the chart below which shows the shape of the Australian government bond curve.
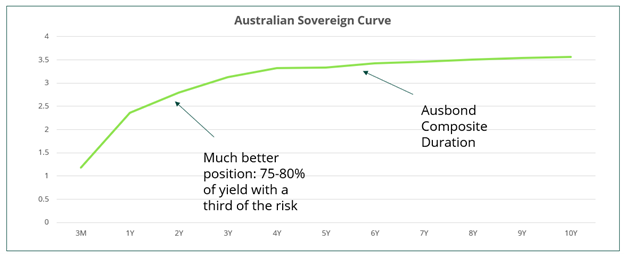
Source: Bloomberg
By buying longer dated assets, expected returns are increased but there is no free lunch. These longer duration assets come with greater interest rate risk, meaning changes in underlying interest rates result in larger changes in bond prices. If a decision is made to extend interest rate duration in a portfolio, we believe a focus on the 1.5-2.0 year part of the curve makes more sense than looking at products with exposure to longer maturities. Investors can pick up about 75-80% of the yield available while only taking on about a third of the interest rate risk embedded in traditional Ausbond Index type products. For this portion of their portfolio, we believe investors should either target shorter duration funds, or choose funds that have flexible mandates to increase interest rate duration in a more optimal way when it makes sense to do so.
In the Danger Zone?
So where does all this leave us in the current environment? Do you feel the need for speed (i.e. is it time to load up on risk) or should you turn in your wings for the moment and sit on the sidelines? We are very much in the latter camp for now. While risk asset markets have corrected a fair bit, on balance it feels like there is still more to come. Central banks are still early in their process of removing accommodation and even they don’t know how far they are going to have to go. If inflation proves challenging to tame and central banks err on the side of dampening inflation at the expense of growth, there could be a rough period ahead for financial markets. Hopefully it doesn’t get so bad that we all need beers to put out the flames.
Disclaimer: Please note that these are the views of the author Mark Mitchell, Managing Director of Daintree, and are not necessarily the views of Daintree. This article does not take into account your investment objectives, particular needs or financial situation and has been prepared for general information purposes only and must not be construed as investment advice or as an investment recommendation.