
Key Points
- Profits have rebounded strongly from pandemic-induced volatility, with credit quality far exceeding expectations.
- Rising interest rates will be supportive to profit margins, provided that the consumer and business customers can navigate rising prices and wobbling growth.
- Risks on the horizon include an elongated slowing cycle, breakdowns in the financial plumbing, and underappreciated risks held on balance sheet that persistently high costs of capital could unearth.
- Yields to invest in bank credit have improved dramatically this year, but market conditions suggest further widening is likely in the months ahead
In preparation for third quarter results season, we have reviewed the second quarter results of banks under coverage. We identified three key takeaways: 1) Pre-provision profits (PPP) are up strongly in 2022, suggesting resilient economic conditions supported by high levels of employment, 2) Lending demand remains positive, but the outlook is growing more uncertain as volatility remains high and the cost of borrowing rises, and 3) Outlook statements portrayed a cautious optimism despite various cross currents. The prospect of recession is growing in many developed markets, with European economic activity most exposed to geopolitical uncertainty and high energy prices. We remain circumspect on the outlook for credit spreads for the remainder of this year, but as they widen they will rebalance the relative value equation and create opportunities, especially if fears of an impending slowdown or recession prove too pessimistic.
Profits pop post-pandemic
The pandemic and its aftermath created significant volatility in bank profits, driven mainly by provisions for potential bad debts that flow through the profit-and-loss statement. When those losses failed to materialise, these provisions were “written back” to current earnings. To remove these impacts, we prefer to look at the more stable PPP measure. For example, in the Euro area PPP was up 25% on the prior corresponding period (pcp), while a broader cross section of European banks recorded a 17% jump.
Local banking juggernaut Commonwealth Bank demonstrated its dominance of the retail banking landscape with a profit report that saw PPP increase by 3%, understating the true performance given that loan losses were -4bp of risk-weighted assets (implying that pre-tax profits were ~$350m higher than pre-provision profits). Australia’s largest bank expects a short, sharp economic cycle locally, which contrasts with its views for the US and UK which have a much greater chance of entering recession mid-to-late next year.
Across the Atlantic, Canadian banks are reporting PPP growth in the high single digits, while loan growth in residential and commercial categories was up by between 12-16% on the pcp, which bodes well for future revenue. Meanwhile, US banks are benefiting from rising net interest income (NII) at the same time as actual loan losses are minimal, supported still by the large stimulus packages of recent years. The reversion to pre-pandemic averages of loan losses suggest that the market has little concern for any meaningful deterioration in asset performance caused by tightening financial conditions.
Figure 1: US bank net charge-off rate
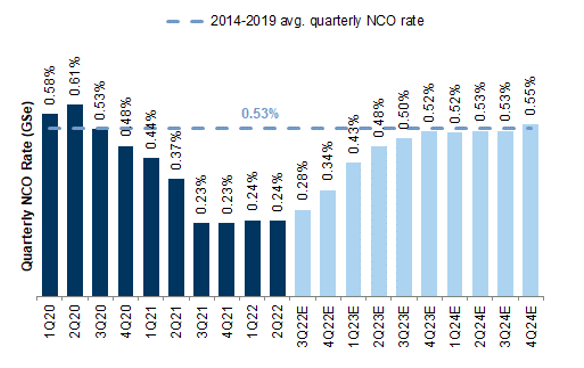
Source: Goldman Sachs
Banks cautiously loosen the lending strings
The prospect of higher interest rates induced the banks to lend to more and different clients over the last year, which saw customer loans increase 5% year-on-year. This increase in risk weighted assets (defined as the value of loans split across several risk categories to determine the amount of capital held against each loan) led to a fall of 8bp in CET1 capital compared to the same period last year. Other banks reporting in this cycle outside of Europe also had positive loan growth, but the prospect of positive rates on the continent is being welcomed with some vigour, despite the multiple challenges on the horizon.
Not all banks will be looking at rising short rates the same way. According to Bloomberg, implied 1-year forward central bank policy rates for developed markets such as the US, Australia and Canada are at or above 4%, while for the UK and New Zealand it is around 4.5%. With significant work still to be done to tame inflation, we see risks emerging for those banks that have significant fixed rate assets on their balance sheet.
Take CBA as an example, which in FY22 absorbed a $33bn increase in its Interest Rate Risk in the Banking Book (IRRBB). In simple terms, the value of their liquid assets such as government and semi-government bonds were revalued as yields rose, requiring capital to be diverted to uses other than lending to customers. The drag created by these movements had the largest impact on regulatory capital over the period. However, CBA’s strong capitalisation overall meant that it was still able to use 10bp of CET1 capital to expand lending during the year.
Figure 2: CBA capital bridge, 2H22
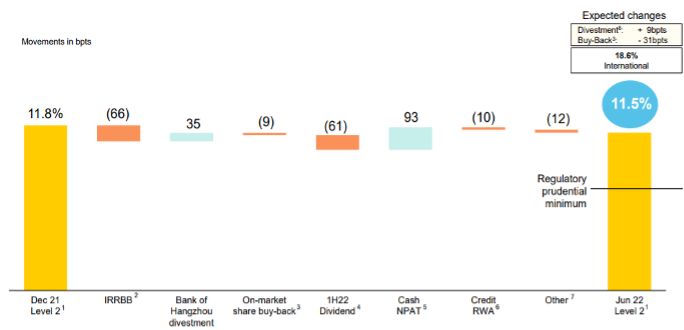
Source: CBA company presentation
The other major Australian banks are likely to report similar trends when they report in October and November. However, the results of similar analysis offshore vary based on the structure and strategy of the individual bank. For example, JP Morgan estimates that their balance sheet and capital is negatively exposed in many different scenarios based on the expected whole-of-bank approach to the prevailing conditions.
Figure 3: JPM earnings at risk, 2Q22
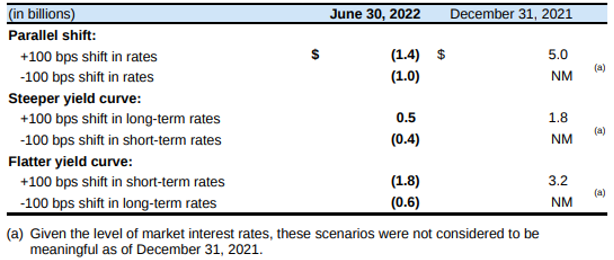
Source: JPM company data
Outlooks tending to the positive
Bank management struck a generally upbeat tone when commenting on the outlook for the remainder of 2022. There were a few notable exceptions, with Danske Bank (still dealing with large money laundering issues uncovered in 2018-19) and Credit Suisse both providing more measured outlook statements.
The outlook commentary fell into three broad categories: a) Revenue and margin guidance, b) underlying profitability, and c) asset quality.
In the UK, Lloyds stood out as achieving peer leading results across these areas, with the CEO commenting on the earnings call:
“Asset quality is in very good shape. The impairment charge of £377 million, equivalent to 17 basis points, is below pre-pandemic levels. Together, this strong performance resulted in statutory profit after tax of £2.8 billion and a return on tangible equity of 13.2 per cent.”
We interpret this as Lloyds management displaying confidence that these results can be maintained into the end of the year, which based on prior market expectations was an upgrade for these key metrics.
UK-domiciled banks in general stood out in terms of result quality. HSBC was confident of being able to improve profitability, while Barclays and Standard Chartered experienced robust markets and trading activity which boosted revenue expectations for the full year despite lingering inflationary and economic concerns.
Furthermore, in a vote of confidence for the sector at large, the ECB approved share buyback programmes for Finland’s Nordea, Italy’s Intesa Sanpaolo and Spain’s BBVA. In our view, this is a strong signal that the ECB sees the wider banking sector in Europe as well placed to respond to any future challenges.
Economic risk on the horizon
The biggest threat to the prevailing positive outlook is sustained economic weakness brought on by cost-of-living pressures or overly restrictive financing costs. Impacts on asset quality will take time to show through if they indeed materialise, but the banking sector can provide insights that may be the “canary in the coal mine”.
Sweden is a case in point. Despite weathering the pandemic better than most countries by following an unconventional strategy, the outlook for economic growth according to the European Commission is one of the weakest across the 27-member bloc. Consumer confidence is also plumbing record lows at the same time as inflation is outstripping expectations.
As a result, in contrast to many other developed economies, the quantum of deposits across the banking system has returned to pre-pandemic levels. There may be any number of explanations for this, but one potential cause is a draw down of excess pandemic savings to fund cost-of-living increases. The Nordic countries are known for high living costs, which are being exacerbated by inflationary pressures.
This will likely force the Riksbank to continue increasing interest rates, with market expectations of the benchmark rate reaching 2% by the end of 2022. Given local property prices have already moderated by about 10% so far this year, risks to the bank lending portfolios will linger for some time to come. Despite this, we believe the Swedish banking system’s world leading capital levels will prove a formidable barrier against credit losses.
Figure 4: Net deposit inflows, Sweden (SEK bn)
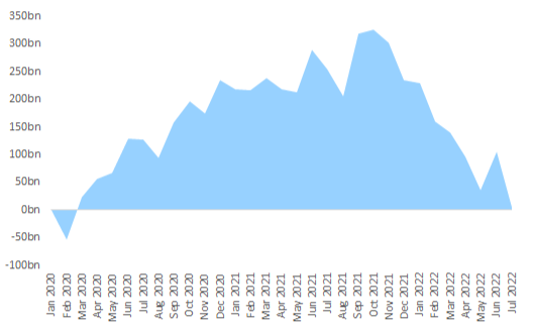
Source: Statistics Sweden, Goldman Sachs
Outlook for credit
Credit spreads have widened all year, including for bonds issued by the banking sector. With a strong foundation provided by solid fundamentals this represents medium-term opportunity for credit investors, but also represents an additional cost pressure for the issuers. Overall, credit spreads for banks suggest a more downbeat economic outlook when compared to a broad index of corporate credit.
Figure 5: Financial and Corporate credit spreads
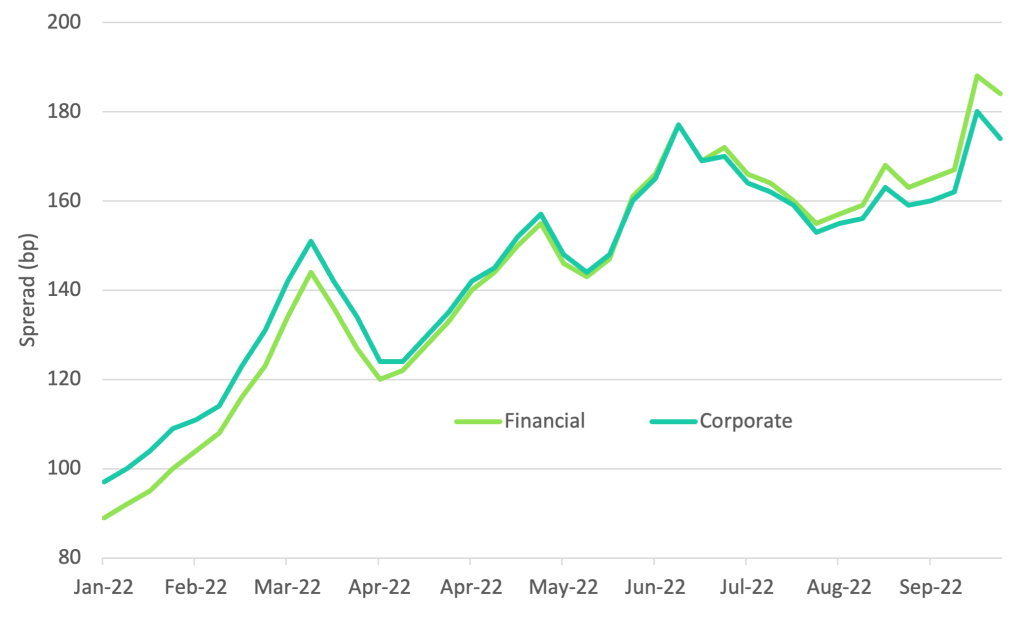
Source: BAML-ICE
Rising interest rates will restrain demand for credit, reducing banks’ overall financing need. Therefore, while we expect net new issuance to be subdued going into 2023, near term maturities will need to be refinanced in what are still unstable markets. This kind of technical environment will likely see spreads continue to drift wider irrespective of the outlook for the economy or credit demand.
We have responded to prevailing conditions by reducing higher beta exposures and preferring a move up in quality and shorter in tenor. Recent purchases of bank credit have been at the front end of the curve, coming with approximately half of the spread duration compared to the portfolio weighted average.
Disclaimer: Please note that these are the views of the author Brad Dunn, Senior Credit Analyst at Daintree, and are not necessarily the views of Daintree. This article does not take into account your investment objectives, particular needs or financial situation and has been prepared for general information purposes only and must not be construed as investment advice or as an investment recommendation.